matlab 画图时部分问题以及解决方法
matlab 画图时部分问题以及解决方法
最近在使用 matlab 画图时,遇到了许许多多各式各样的问题,有些问题甚至折腾了很久才搞好,特此记录下来。
1. 设置画图时图中线段的粗细
plot(x1,y1,'b-','LineWidth',2);
2. 设置x轴y轴的范围
axis([0,3000,0,100]);
3. 多张图在一个页面中绘出
% 绘完每张图后在使用 hold on,并在最后使用 hold off
plot(x1,y1,'b-','LineWidth',2);
hold on;
plot(x2,y2,'r:','LineWidth',2);
hold off;
4. 设置图例的位置
% Location 表示相对于坐标的位置,northwest 表示 左上
legend('location', 'northwest');
5. 去除图中上方与右方的的边框
- 方法一:在绘图操作(plot)之前添加 hold on; 即可
hold on; plot(x1,y1,'b-','LineWidth',2); - 方法二:在绘图操作(plot)之后添加 box off; 即可
plot(x1,y1,'b-','LineWidth',2);
box off;
6. 设置 X 轴标签为中文
set(gca,'XTickLabel',{'第一个','第二个','第三个'});
7. 为柱状图进行形状填充
使用自封装函数 applyhatch.m,相关链接:https://www.ilovematlab.cn/thread-177581-1-1.html
-
首先新建函数脚本
applyhatch.m% applyhatch.m function applyhatch(h,patterns,colorlist) % APPLYHATCHApply hatched patterns to a figure % APPLYHATCH(H,PATTERNS) creates a new figure from the figure H by % replacing distinct colors in H with the black and white % patterns in PATTERNS. The format for PATTERNS can be % a string of the characters '/', '\', '|', '-', '+', 'x', '.' % a cell array of matrices of zeros (white) and ones (black) % % APPLYHATCH(H,PATTERNS,COLORS) maps the colors in the n by 3 % matrix COLORS to PATTERNS. Each row of COLORS specifies an RGB % color value. % % Note this function makes a bitmap image of H and so is limited % to low-resolution, bitmap output. % % Example 1: % bar(rand(3,4)); % applyhatch(gcf,'\-x.'); % % Example 2: % colormap(cool(6)); % pie(rand(6,1)); % legend('Jan','Feb','Mar','Apr','May','Jun'); % applyhatch(gcf,'|-+.\/',cool(6)); % % See also: MAKEHATCH % By Ben Hinkle, % This code is in the public domain. oldppmode= get(h,'paperpositionmode'); oldunits= get(h,'units'); set(h,'paperpositionmode','auto'); set(h,'units','pixels'); figsize= get(h,'position'); if nargin == 2 colorlist = []; end bits= hardcopy(h,'-dzbuffer','-r0'); set(h,'paperpositionmode',oldppmode); bwidth= size(bits,2); bheight= size(bits,1); bsize= bwidth * bheight; if~isempty(colorlist) colorlist = uint8(255*colorlist); [colors,colori] = nextnonbw(0,colorlist,bits); else colors = (bits(:,:,1) ~= bits(:,:,2)) | ... (bits(:,:,1) ~= bits(:,:,3)); end pati= 1; colorind= find(colors); while~isempty(colorind) colorval(1) = bits(colorind(1)); colorval(2) = bits(colorind(1)+bsize); colorval(3) = bits(colorind(1)+2*bsize); if iscell(patterns) pattern = patterns{pati}; elseif isa(patterns,'char') pattern = makehatch(patterns(pati)); else pattern = patterns; end pattern = uint8(255*(1-pattern)); pheight = size(pattern,2); pwidth = size(pattern,1); ratioh = ceil(bheight/pheight); ratiow = ceil(bwidth/pwidth); bigpattern = repmat(pattern,[ratioh ratiow]); if ratioh*pheight > bheight bigpattern(bheight+1:end,:) = []; end if ratiow*pwidth > bwidth bigpattern(:,bwidth+1:end) = []; end bigpattern = repmat(bigpattern,[1 1 3]); color = (bits(:,:,1) == colorval(1)) & ... (bits(:,:,2) == colorval(2)) & ... (bits(:,:,3) == colorval(3)); color = repmat(color,[1 1 3]); bits(color) = bigpattern(color); if ~isempty(colorlist) [colors,colori] = nextnonbw(colori,colorlist,bits); else colors = (bits(:,:,1) ~= bits(:,:,2)) | ... (bits(:,:,1) ~= bits(:,:,3)); end colorind = find(colors); pati = (pati + 1); if pati > length(patterns) pati = 1; end end newfig= figure('units','pixels','visible','off'); imaxes= axes('parent',newfig,'units','pixels'); im= image(bits,'parent',imaxes); fpos= get(newfig,'position'); set(newfig,'position',[fpos(1:2) figsize(3) figsize(4)+1]); set(imaxes,'position',[0 0 figsize(3) figsize(4)+1],'visible','off'); set(newfig,'visible','on'); function [colors,out] = nextnonbw(ind,colorlist,bits) out = ind+1; colors = []; while out <= size(colorlist,1) if isequal(colorlist(out,:),[255 255 255]) | ... isequal(colorlist(out,:),[0 0 0]) out = out+1; else colors = (colorlist(out,1) == bits(:,:,1)) & ... (colorlist(out,2) == bits(:,:,2)) & ... (colorlist(out,3) == bits(:,:,3)); return end end % 而applyhatch函数需要调用下面的函数 function A = makehatch(hatch) %MAKEHATCH Predefined hatch patterns % MAKEHATCH(HATCH) returns a matrix with the hatch pattern for HATCH % according to the following table: % HATCH pattern % ------- --------- % / right-slanted lines % \ left-slanted lines % | vertical lines % - horizontal lines % + crossing vertical and horizontal lines % x criss-crossing lines % . single dots % % See also: APPLYHATCH % By Ben Hinkle, % This code is in the public domain. n = 6; A=zeros(n); switch (hatch) case '/' A = fliplr(eye(n)); case '\' A = eye(n); case '|' A(:,1) = 1; case '-' A(1,:) = 1; case '+' A(:,1) = 1; A(1,:) = 1; case 'x' A = eye(n) | fliplr(diag(ones(n-1,1),-1)); case '.' A(1:2,1:2)=1; otherwise error(['Undefined hatch pattern "' hatch '".']); end -
第二部在需要的地方调用函数
%为柱状图进行形状填充,\.x- 为填充类型,可继续往后添加,详见 applyhatch.m 源码
bar(y);
applyhatch(gcf,'\.x-');
8. 当坐标轴数字太大时,设置坐标轴不用科学计数法表示
%设置柱状图 y 坐标不用科学计数法表示
y_val=get(gca,'YTick');   %为了获得y轴句柄
y_str=num2str(y_val');    %为了将数字转换为字符数组
set(gca,'YTickLabel',y_str);    %显示
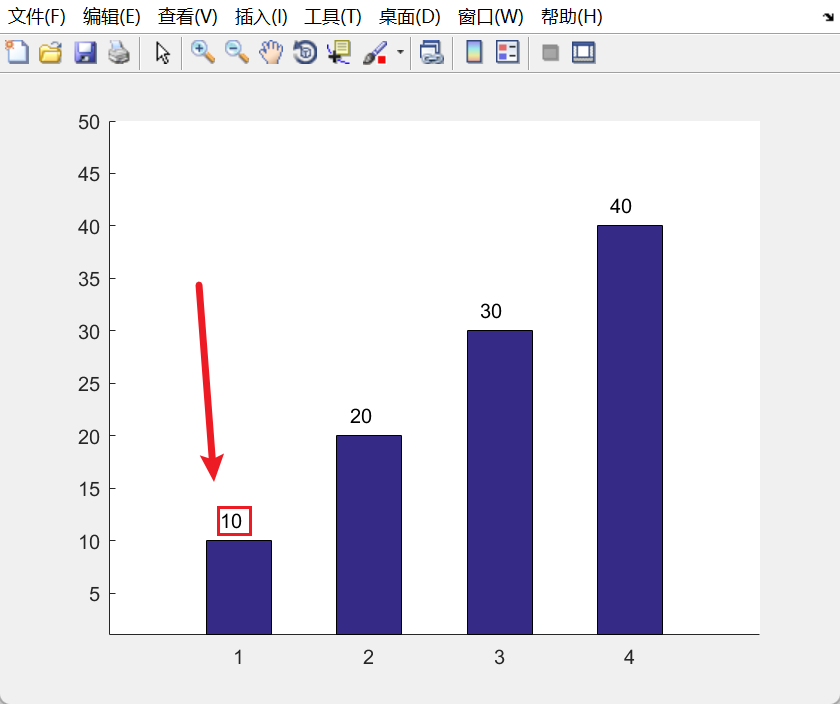
9. 在柱状图上方显示数据
%使用 text(xt,yt,str_num) 函数,xt,yt 表示坐标,str_num 表示 str 类型的数据

y=[10,20,30,40];
xy=bar(y,0.5);
axis([0,5,1,50]);
%去除上边和右边的边框
box off;
%设置柱状图上方数据
for i = 1:4
    text(i-0.15,y(i)+2,num2str(y(i)));
end